Help & Documentation
Database Overview
STARK (Single-cell Transcription stARt site Knowledgebase) is a comprehensive single-cell TSS (Transcription Start Site) database browser. It integrates single-cell RNA-seq data from multiple cancer types to provide detailed insights into TSS usage, gene expression, and cell-type specificity.
The database currently contains 428 samples across 14 cell types, with a total of over 2.2 million cells. Each sample has been processed through a standardized pipeline including UMAP embedding, cell-type annotation, and TSS quantification.
Use the navigation bar above to explore different aspects of the data. Each section is described below.
Samples Browser
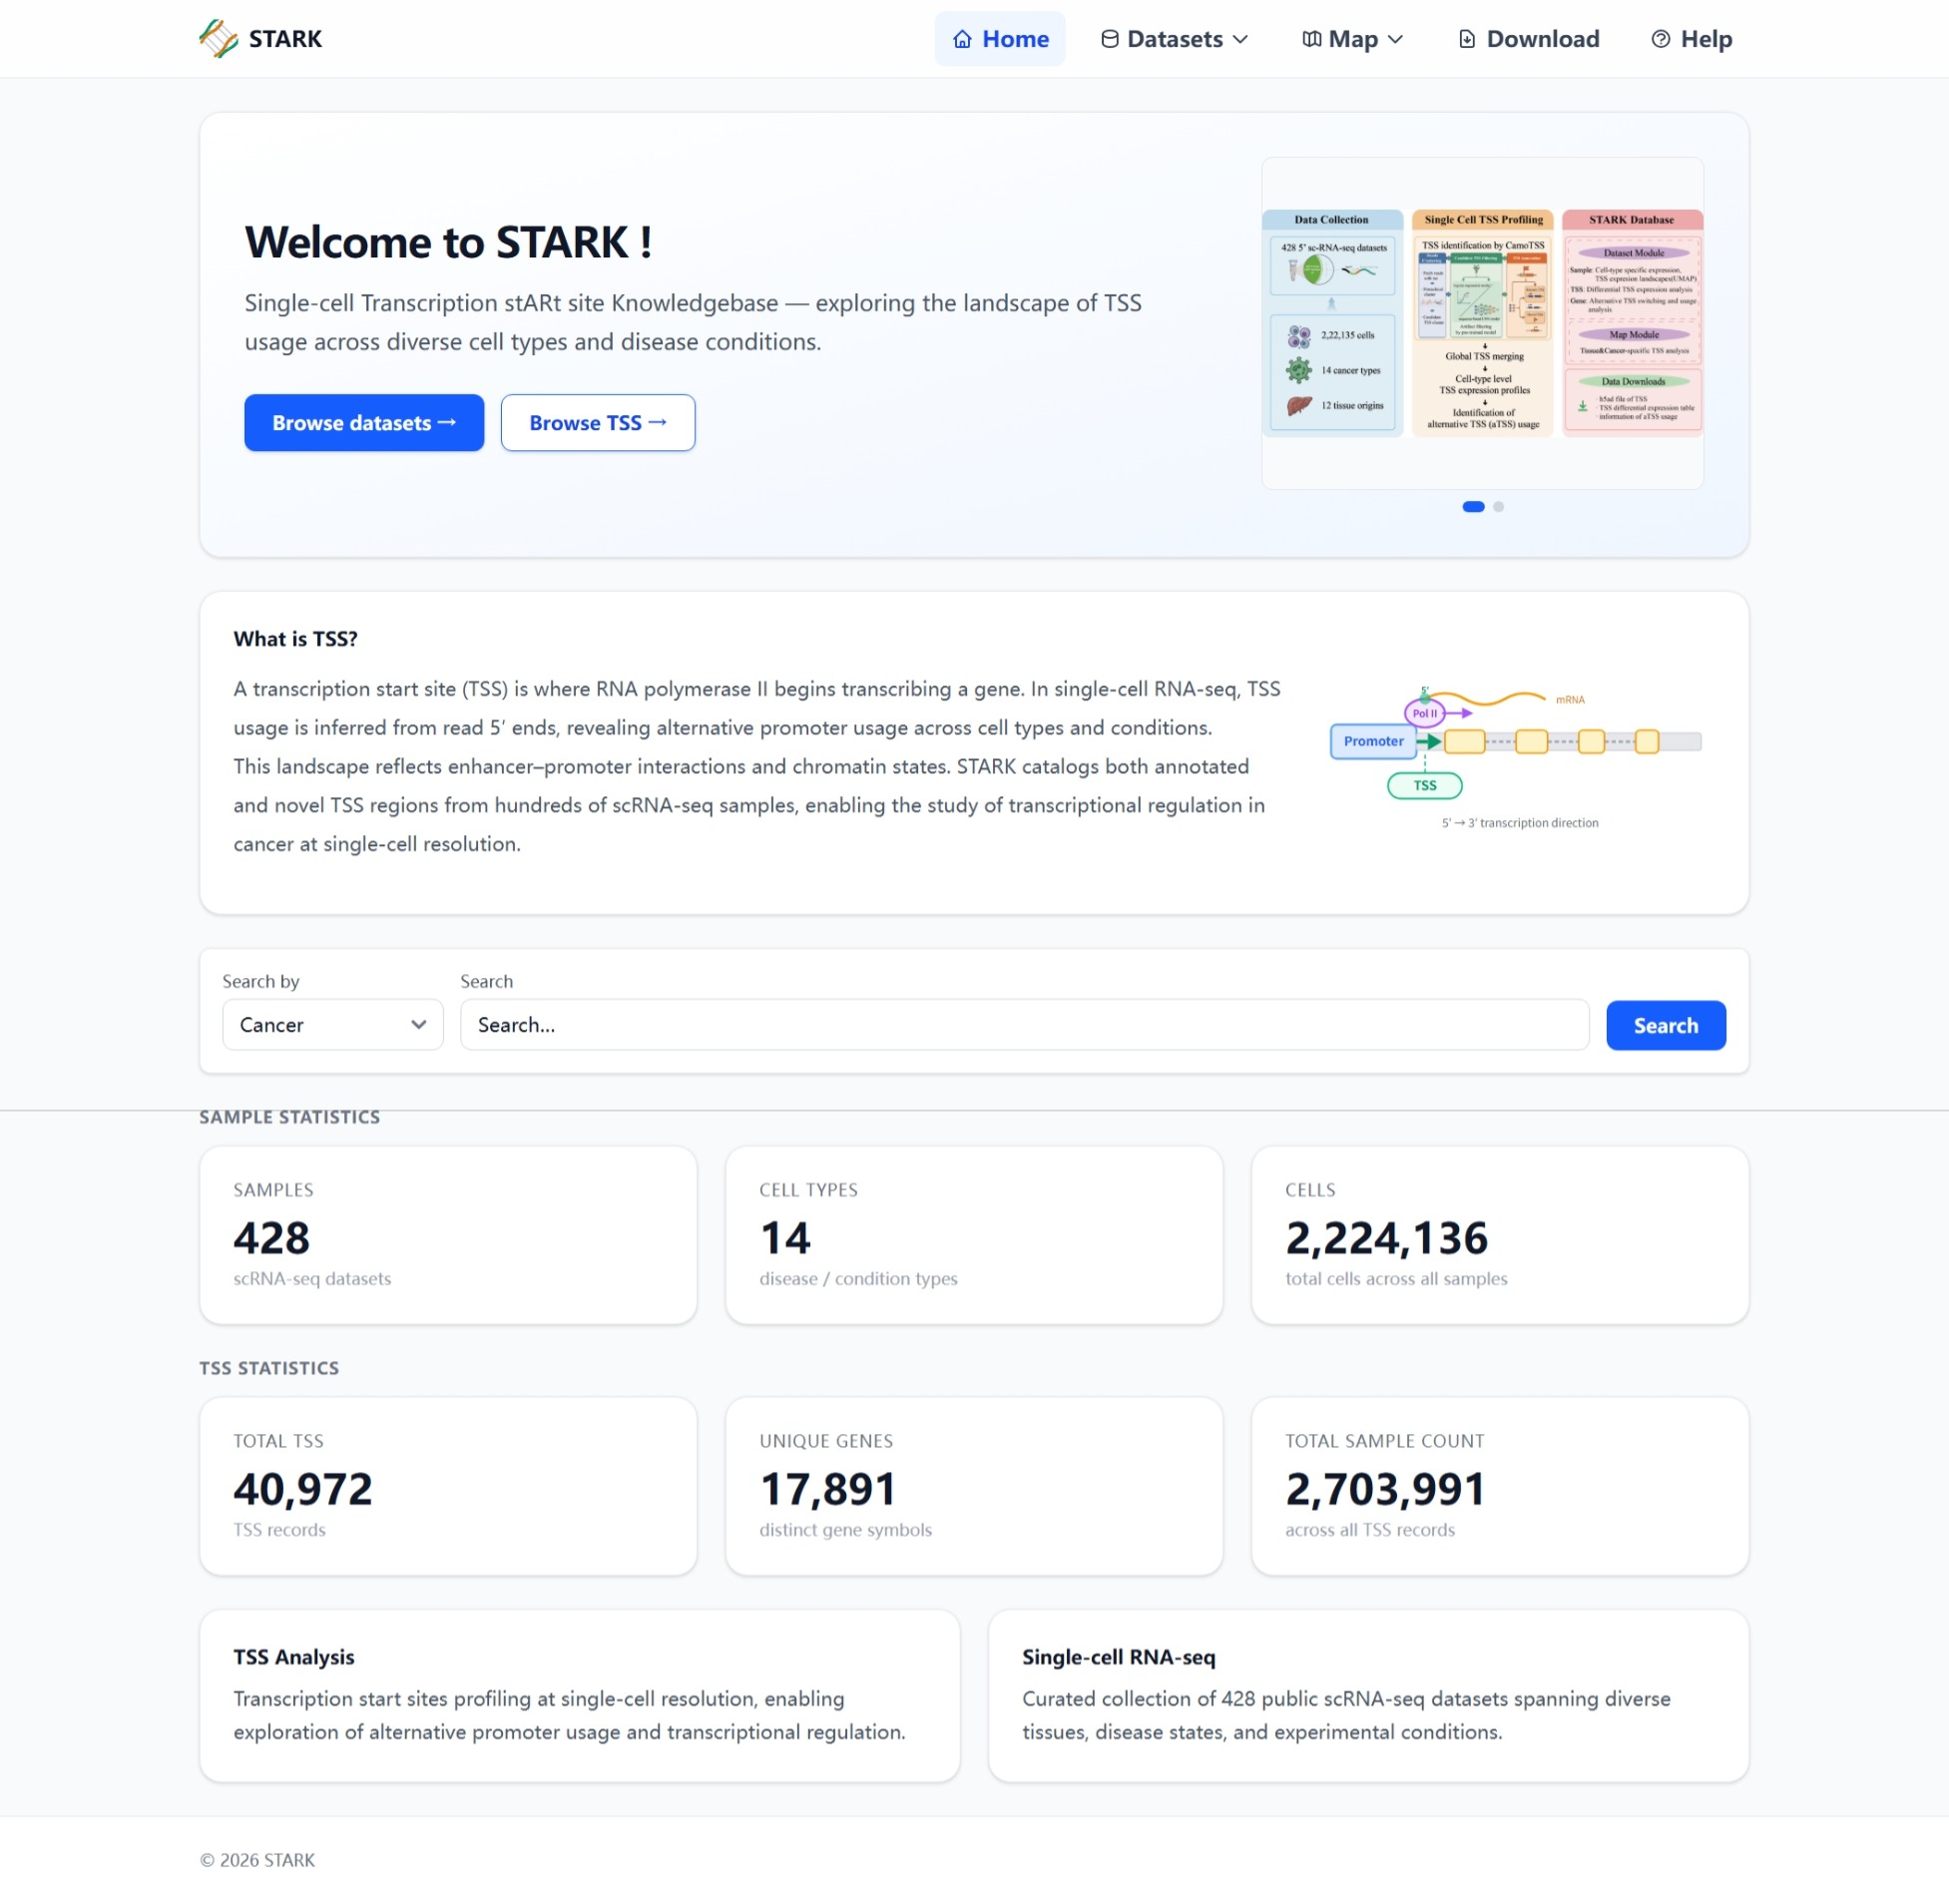
The Samples Browser page provides a searchable, filterable table of all 428 samples in the database.
- Search by keyword across sample titles.
- Filter by SRR, Study Accession, Source, Cancer type, and Tissue.
- Sort any column by clicking the column header.
- Select rows with checkboxes and Export to CSV.
- Click an SRR to view the Sample Detail page.
TSS Browser
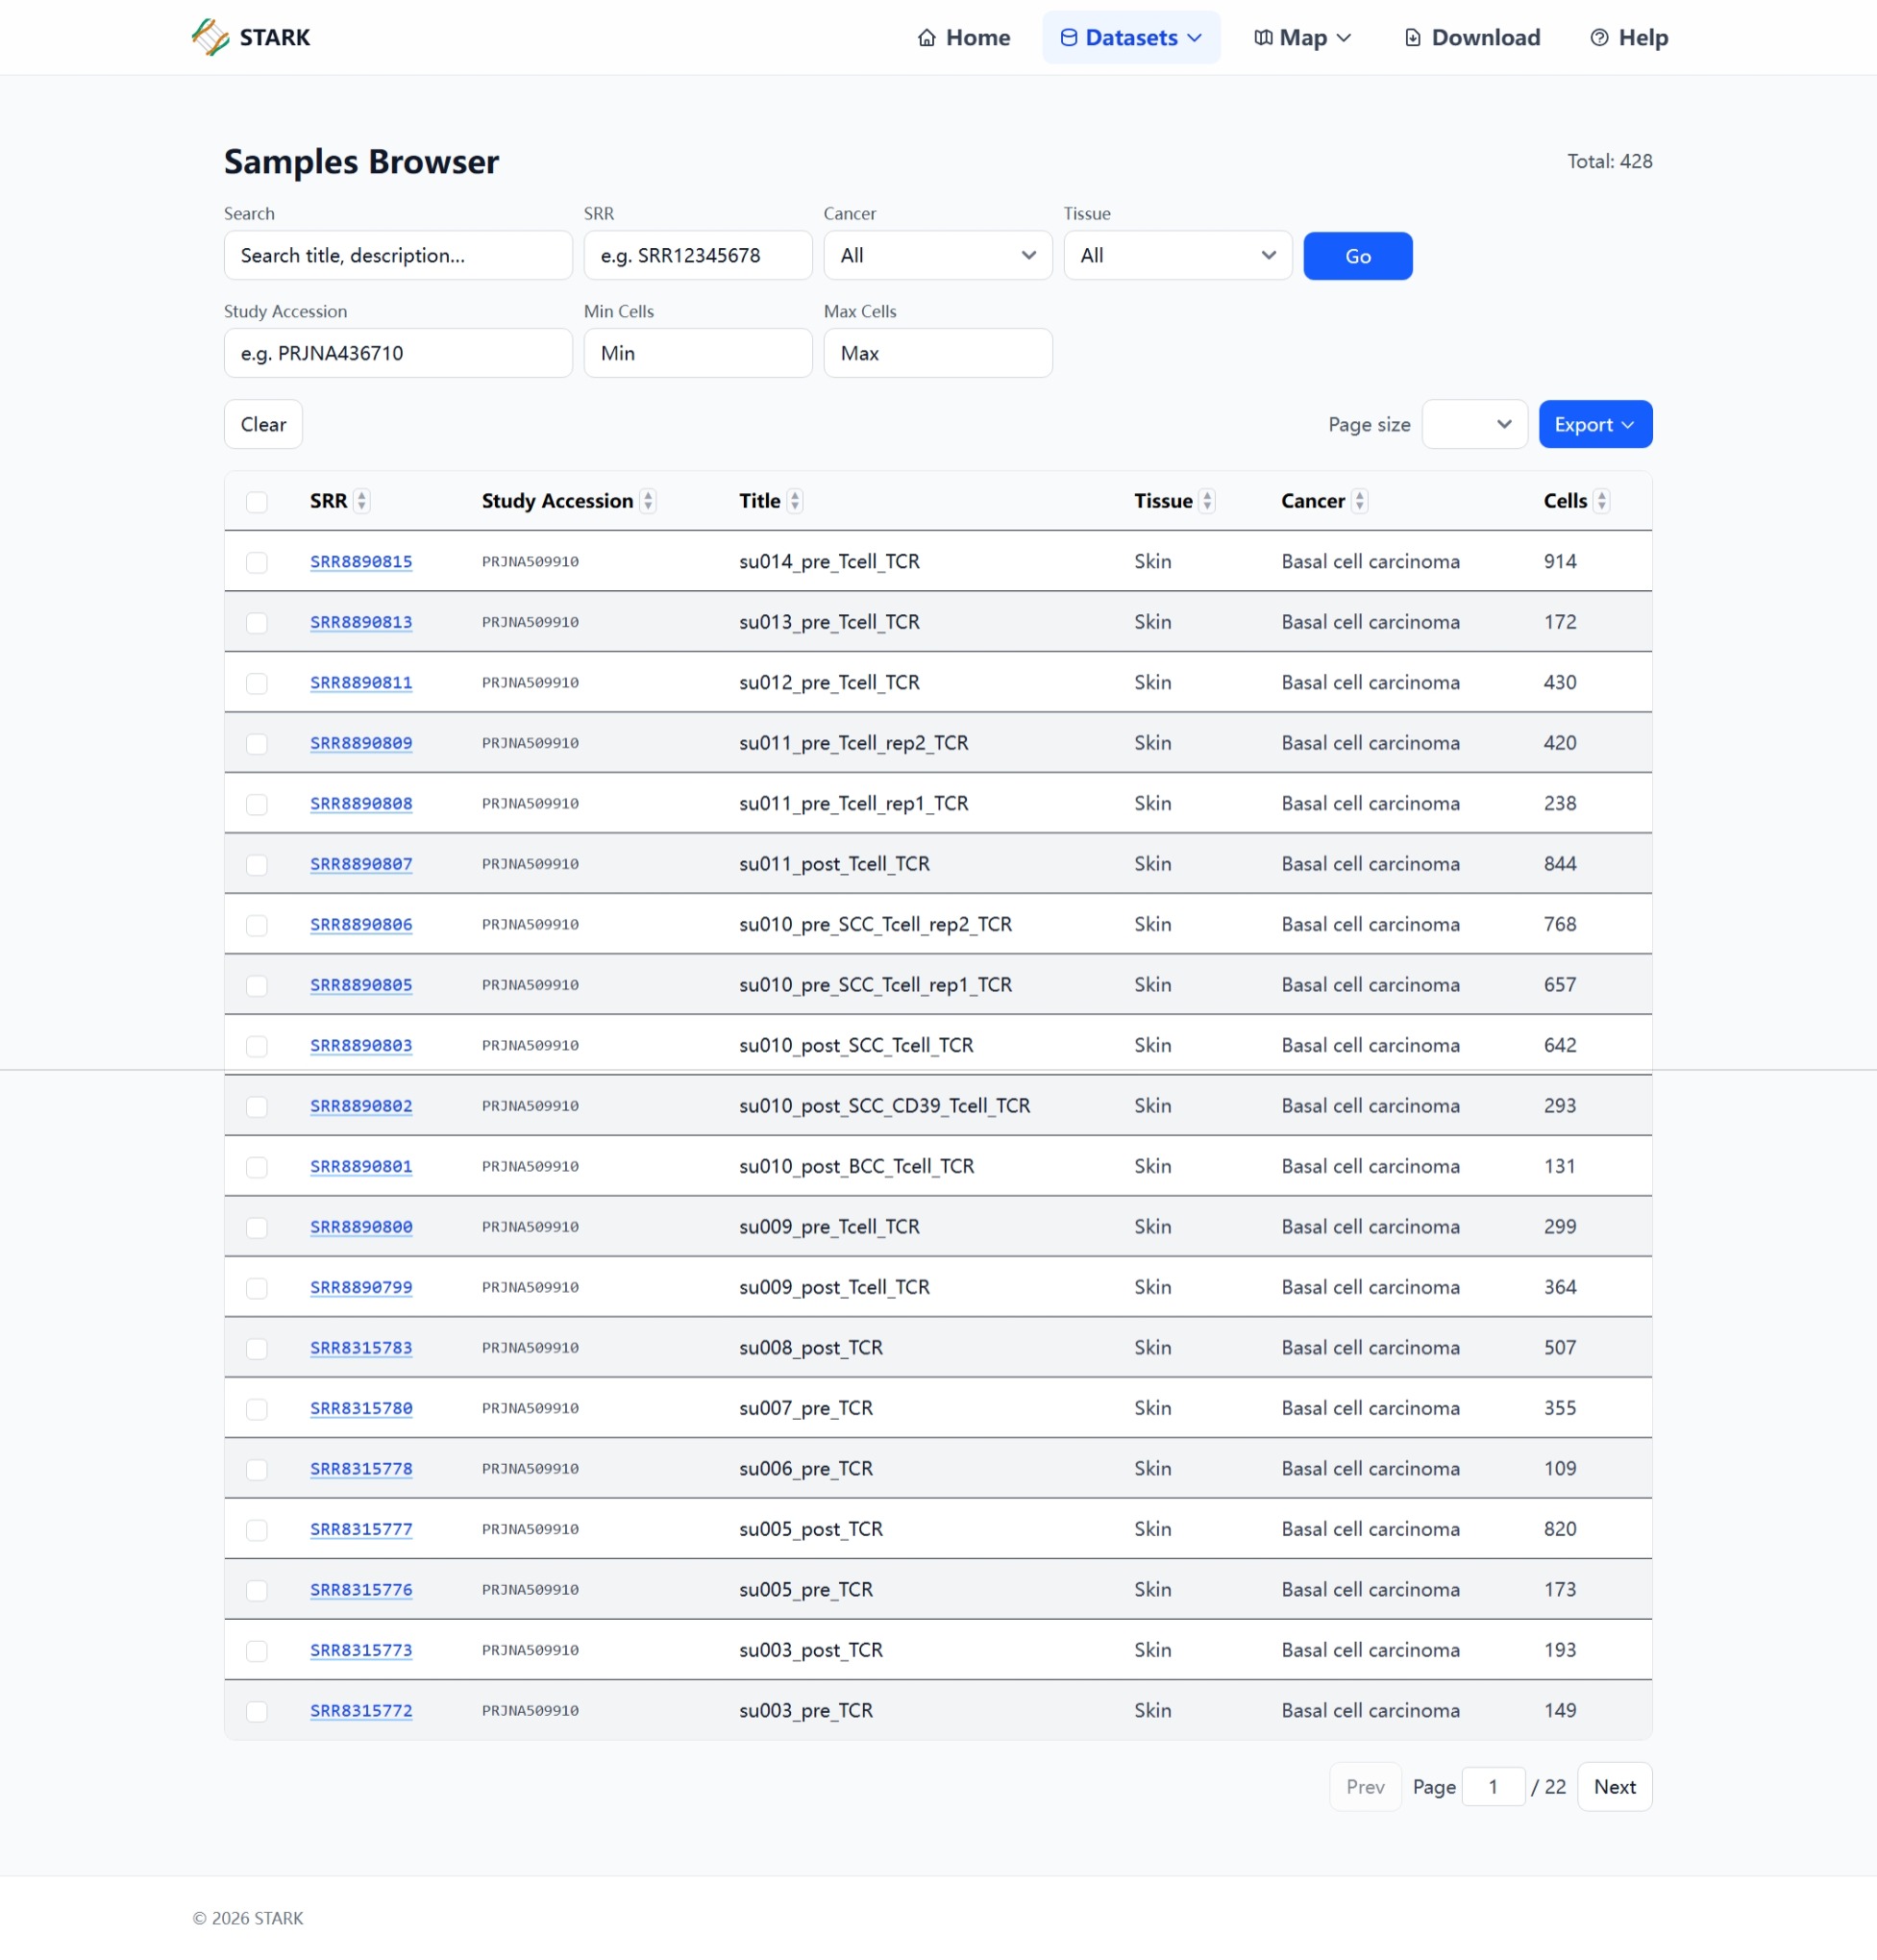
The TSS Browser page lists all transcription start sites (~41K records) identified across the dataset.
- Search by TSS ID or Gene Symbol with autocomplete suggestions.
- Filter by TSS Type (Canonical / Novel) and Chromosome.
- Sort any column by clicking the column header.
- Export selected or all records to CSV.
- Click a TSS ID to view the TSS Detail page.
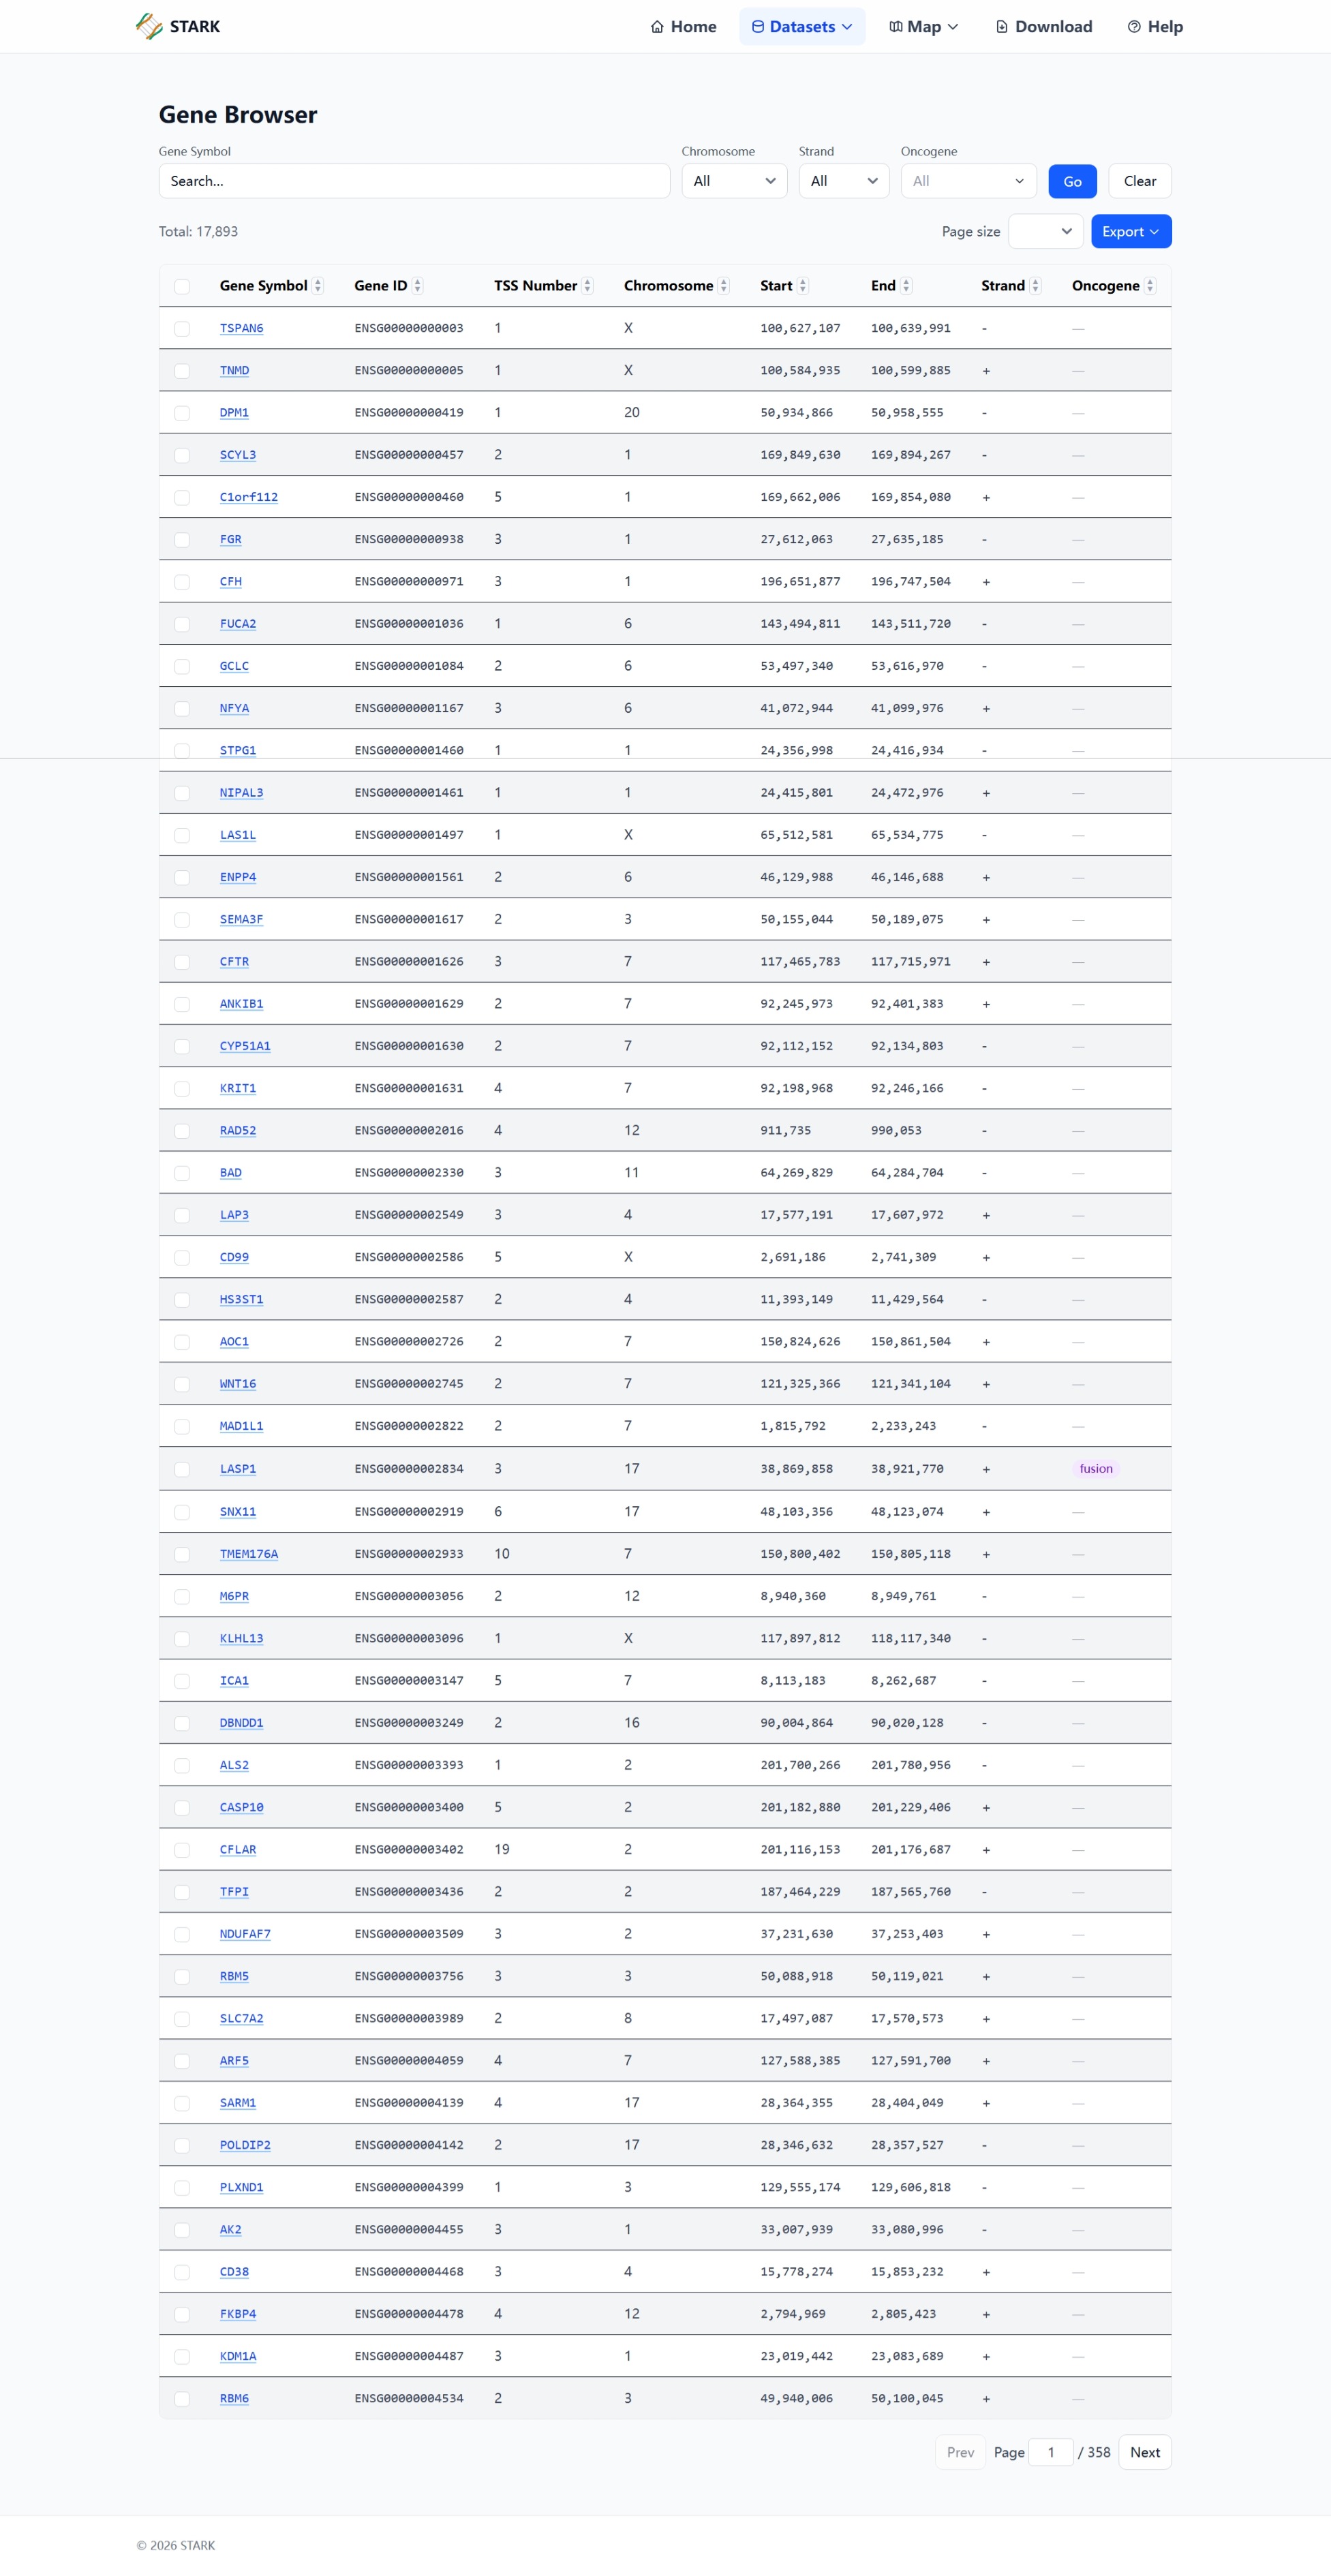
Gene Browser
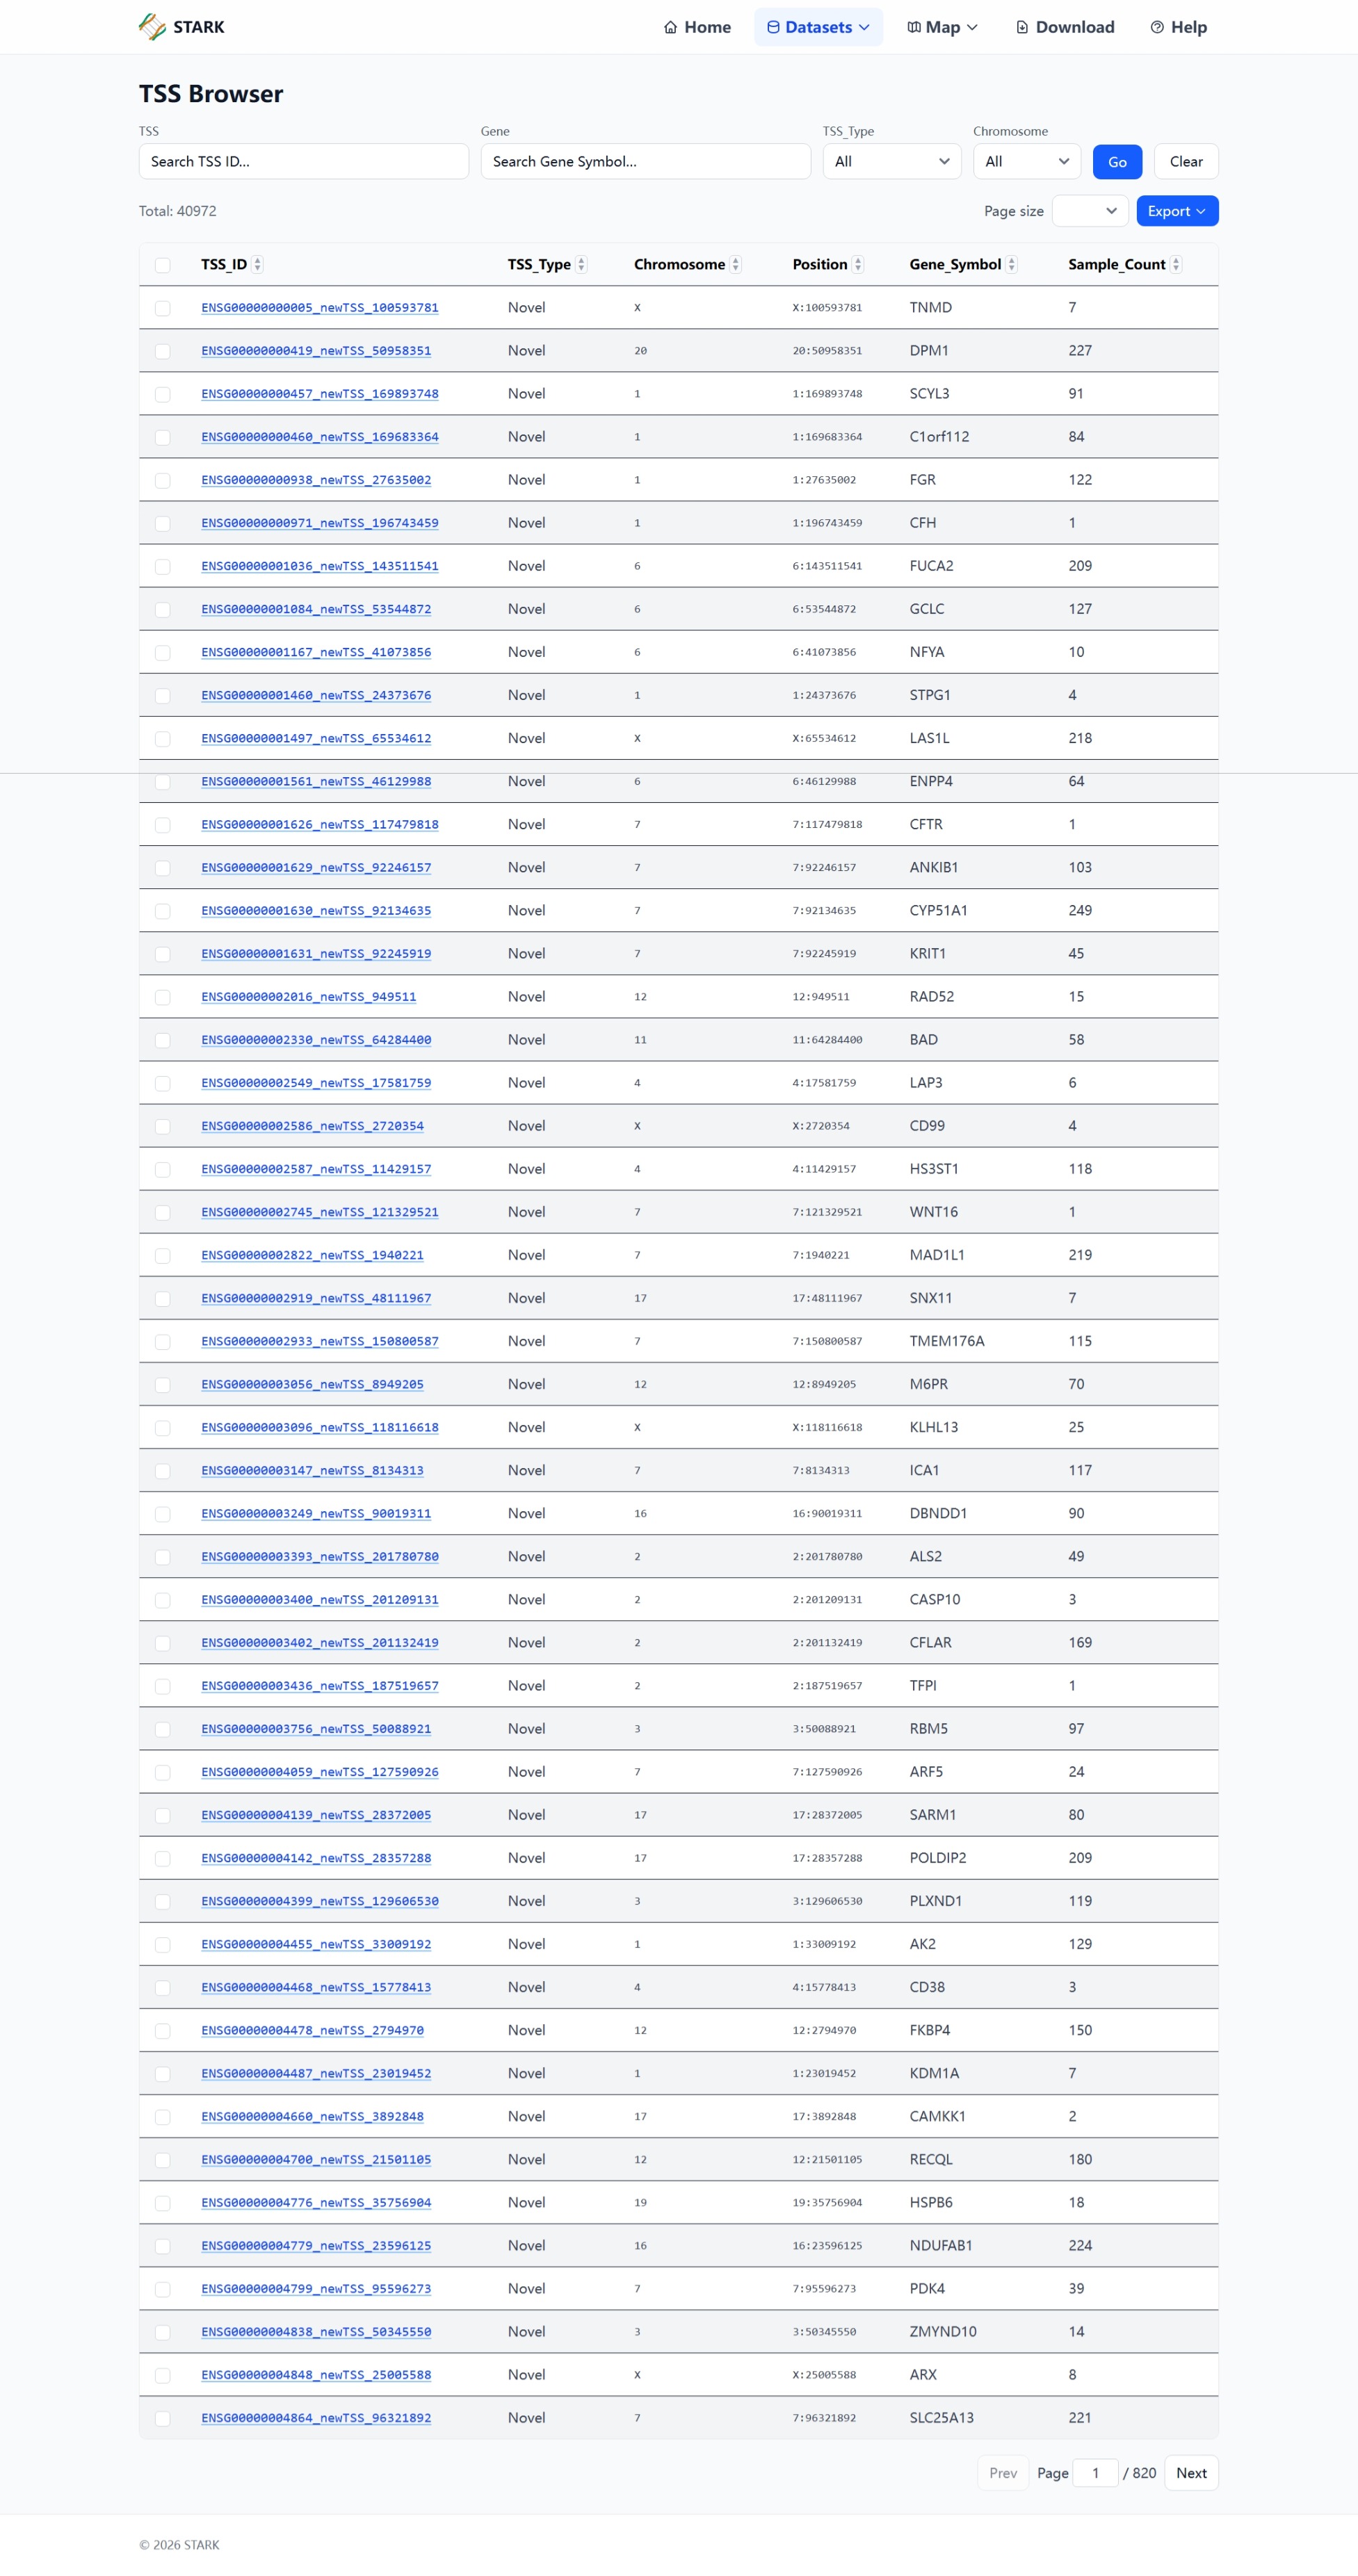
The Gene Browser page provides an overview of genes and their associated TSS variants.
- Search by Gene Symbol with autocomplete suggestions.
- Filter by Chromosome and Strand.
- Sort any column by clicking the column header.
- Export selected or all records to CSV.
- Click a Gene Symbol to view the Gene Detail page.
Map
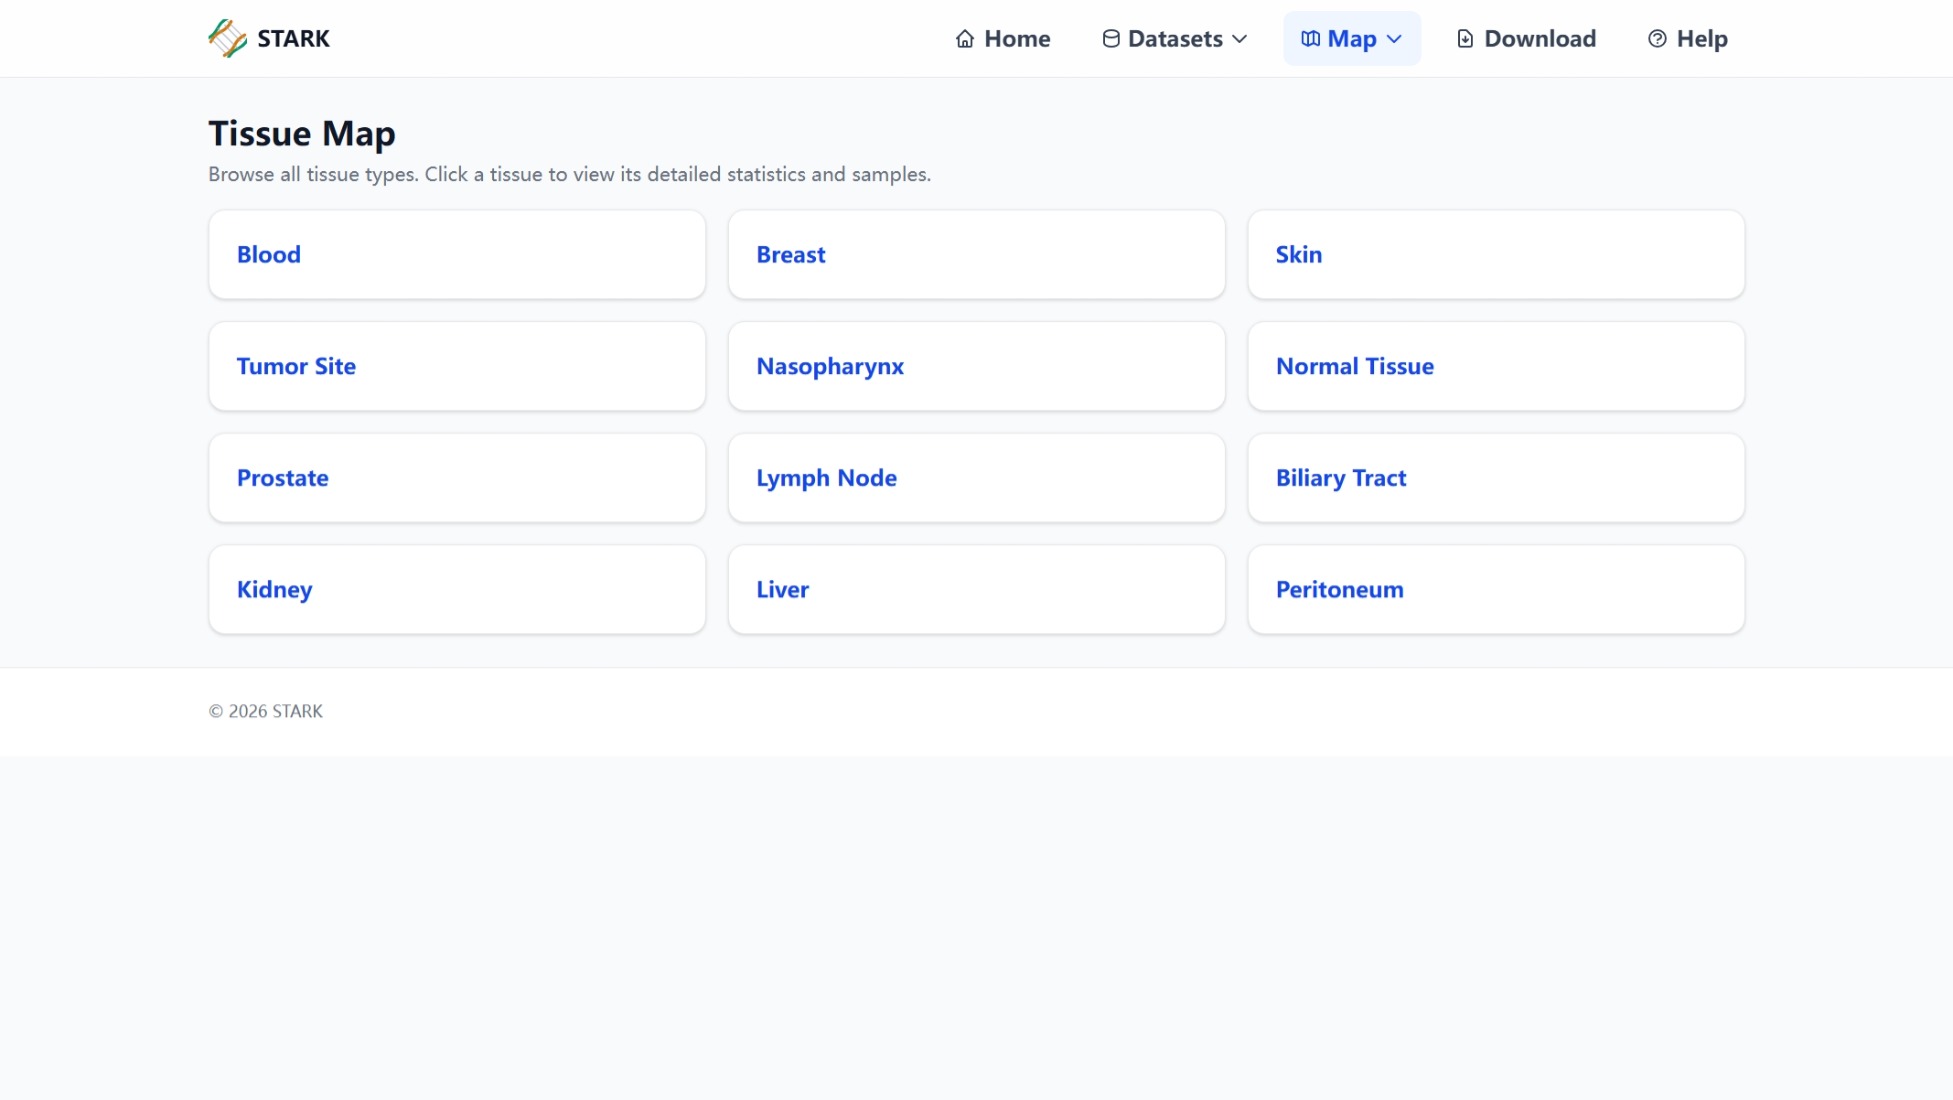
The Map section provides aggregated statistics and visualizations grouped by Tissue or Cancer type.
- Tissue Map — browse samples by tissue of origin.
- Cancer Map — browse samples by cancer type.
- Each detail page shows summary cards, an integrated UMAP plot, and a sample list.
- The UMAP can be colored by Cell Type or Sample ID.
Download
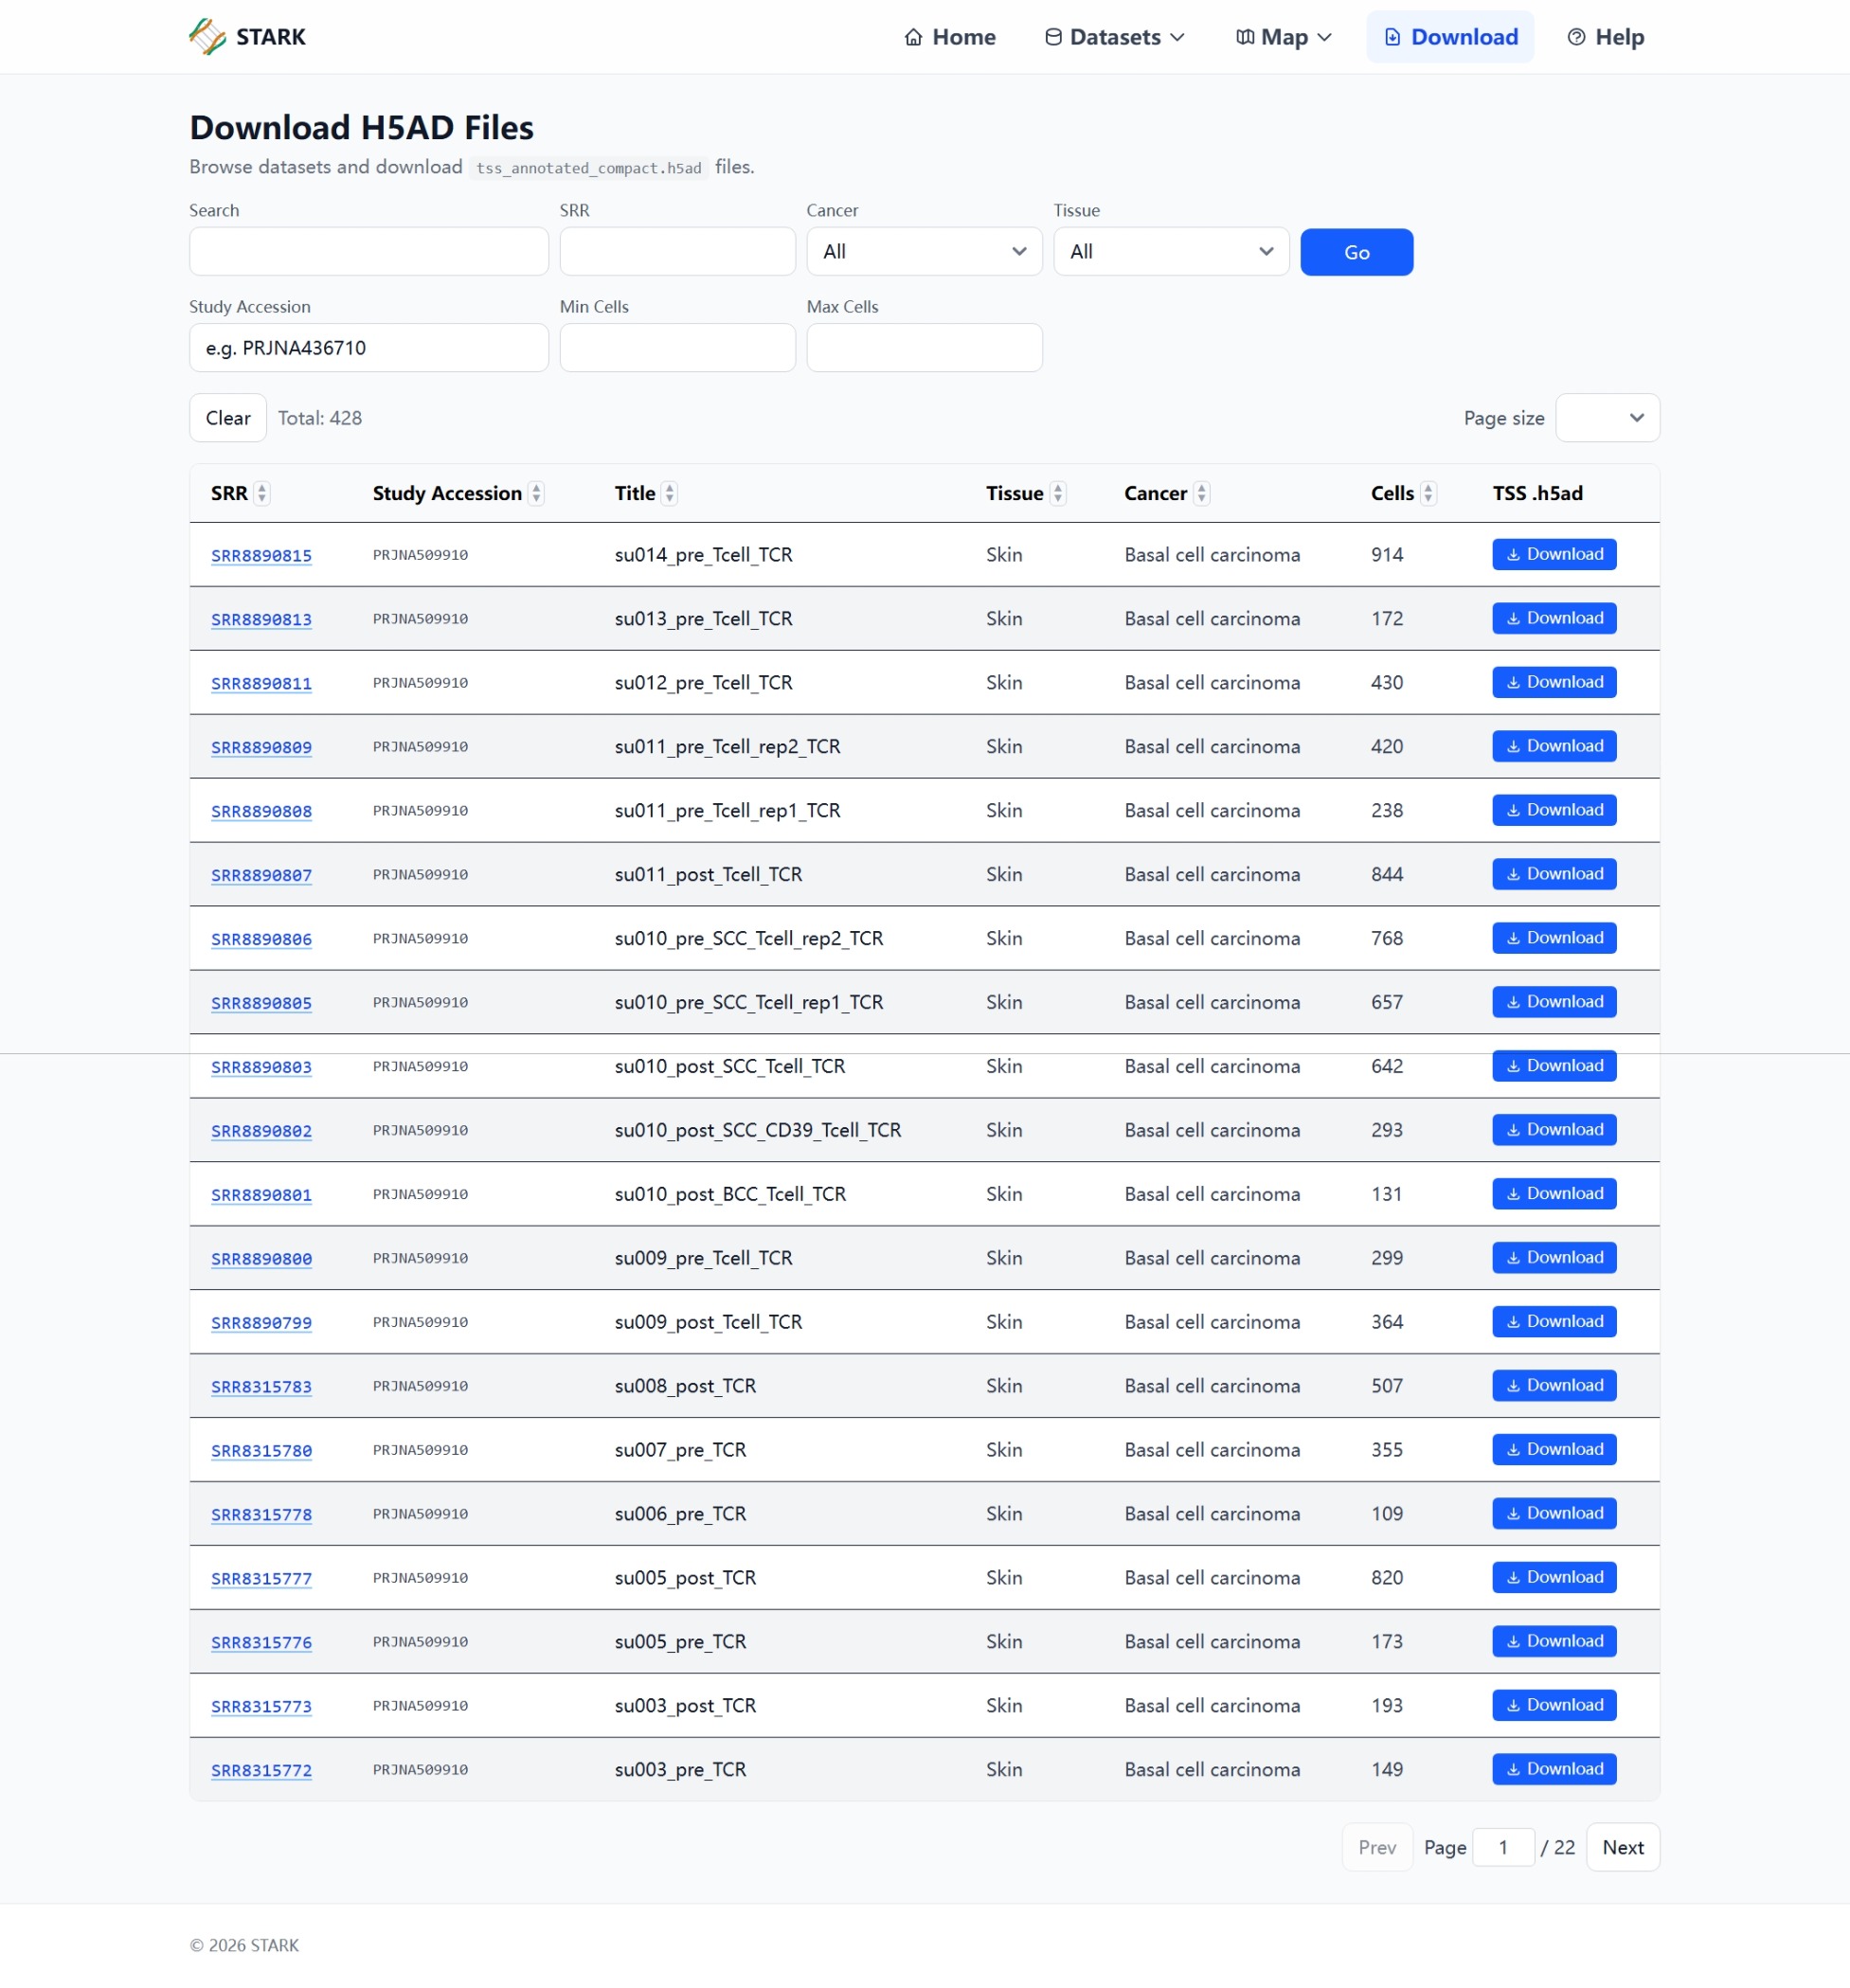
The Download page allows you to browse samples and download their associated TSS annotated .h5ad files (compact format).
- Search and filter samples by various criteria.
- File availability is automatically checked.
- Click the TSS button to download the corresponding .h5ad file.
Sample Detail
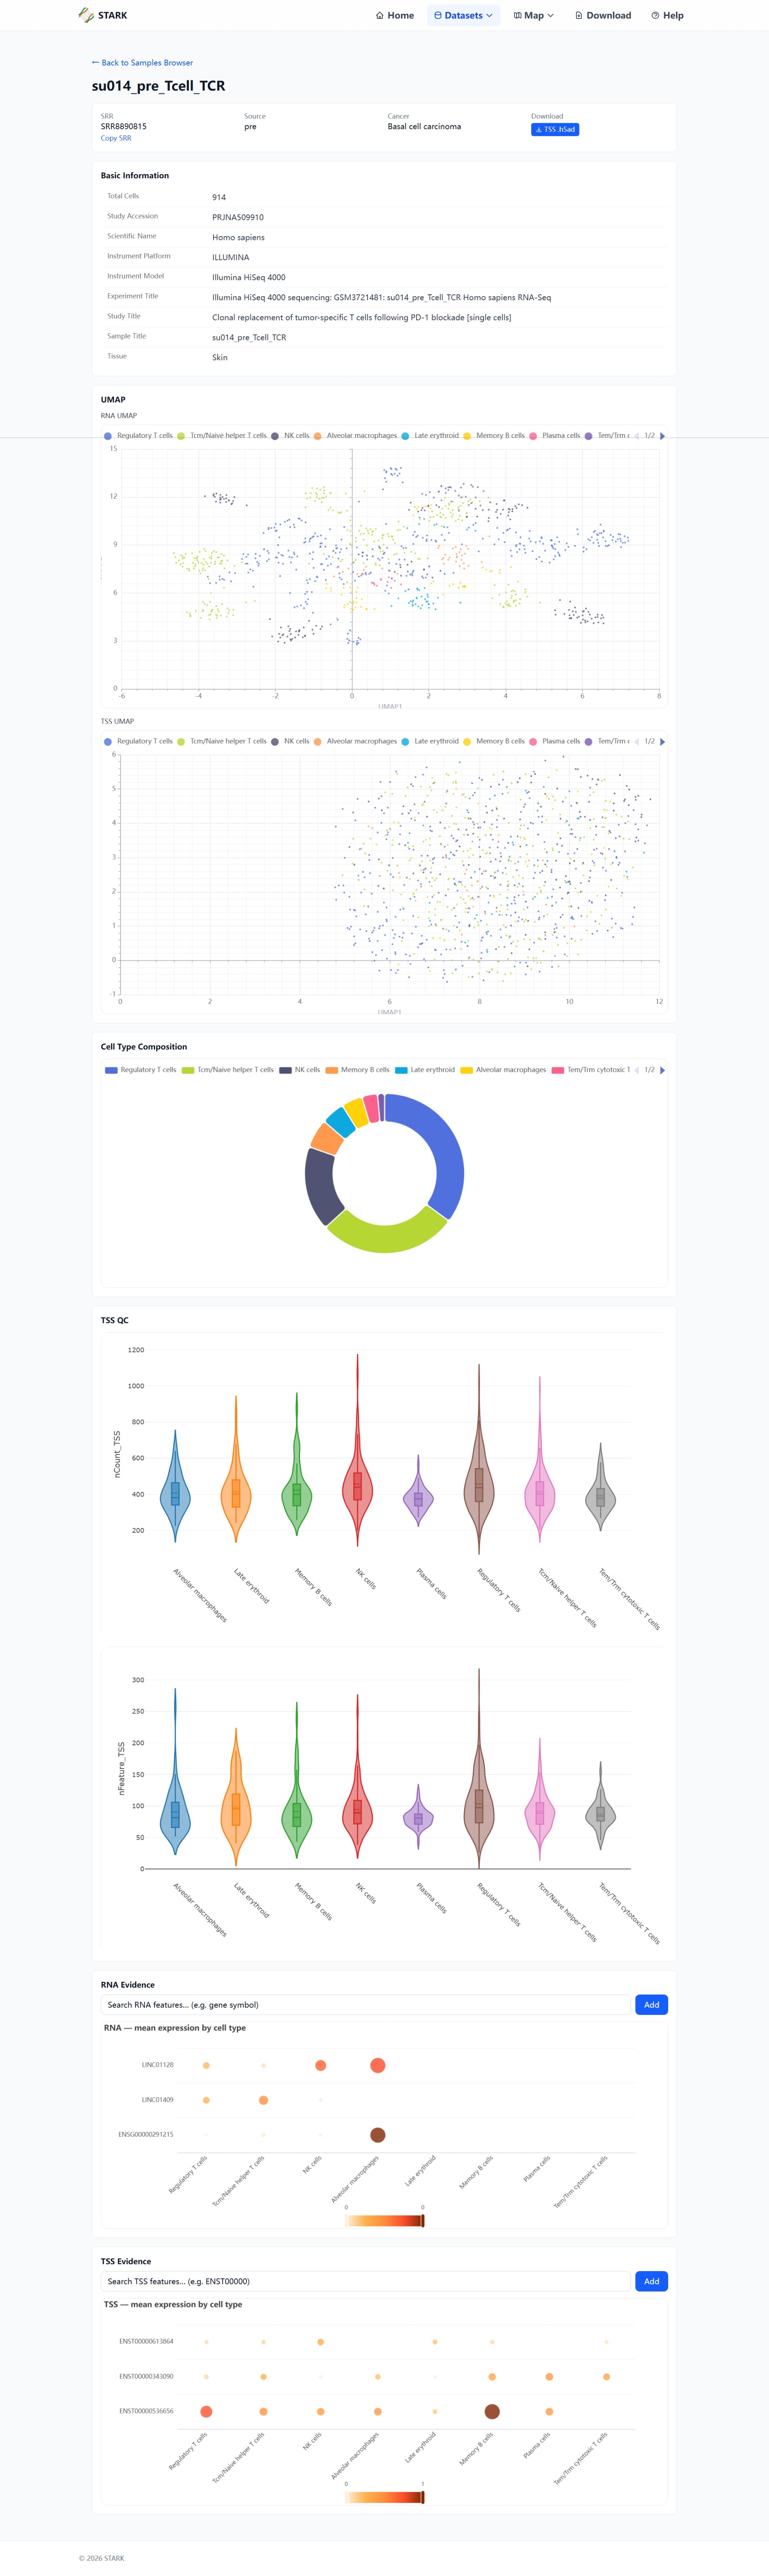
The Sample Detail page (accessible from the Samples Browser) provides an in-depth view of a single sample.
- Basic Information — metadata including tissue, cancer type, and cell count.
- UMAP — interactive scatter plot of cell embeddings colored by cell type.
- Cell Type Composition — donut chart showing cell type proportions.
- TSS QC — violin and box plots for TSS quality metrics.
- RNA/TSS Evidence — bubble plot showing gene expression and TSS usage across cell types.
- Download — direct links to TSS .h5ad files.
TSS Detail
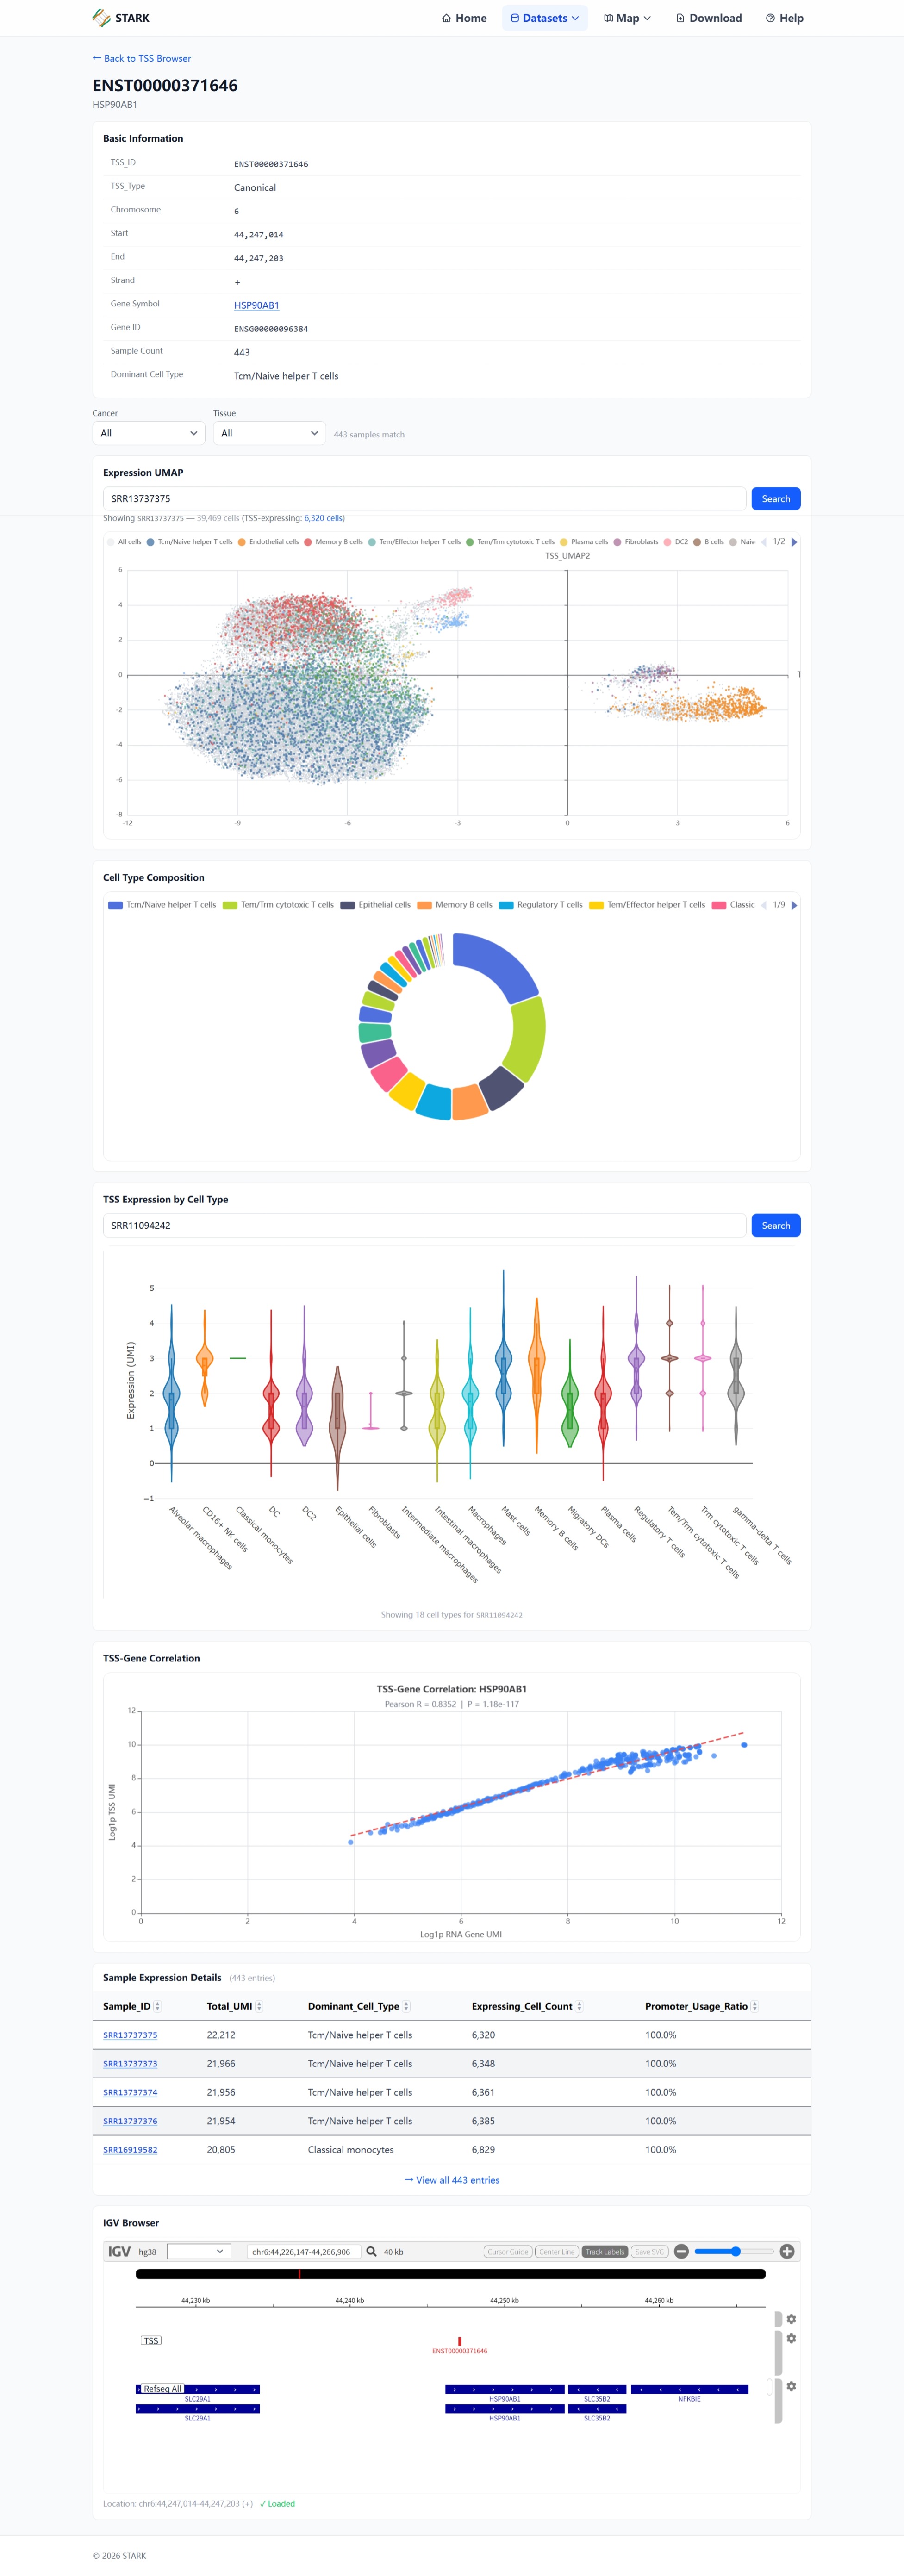
The TSS Detail page (accessible from the TSS Browser) provides comprehensive information about a single transcription start site.
- Basic Information — genomic coordinates, strand, and gene annotation.
- Expression UMAP — overlay of TSS-expressing cells on the sample background UMAP.
- Cell Type Composition — pie chart of cell types expressing this TSS.
- TSS Expression by Cell Type — violin plots showing expression distribution per cell type.
- TSS-Gene Correlation — scatter plot with regression line showing RNA vs TSS UMI correlation.
- Sample Expression Details — table of expression metrics per sample.
- IGV Browser — genome browser view of the TSS locus.
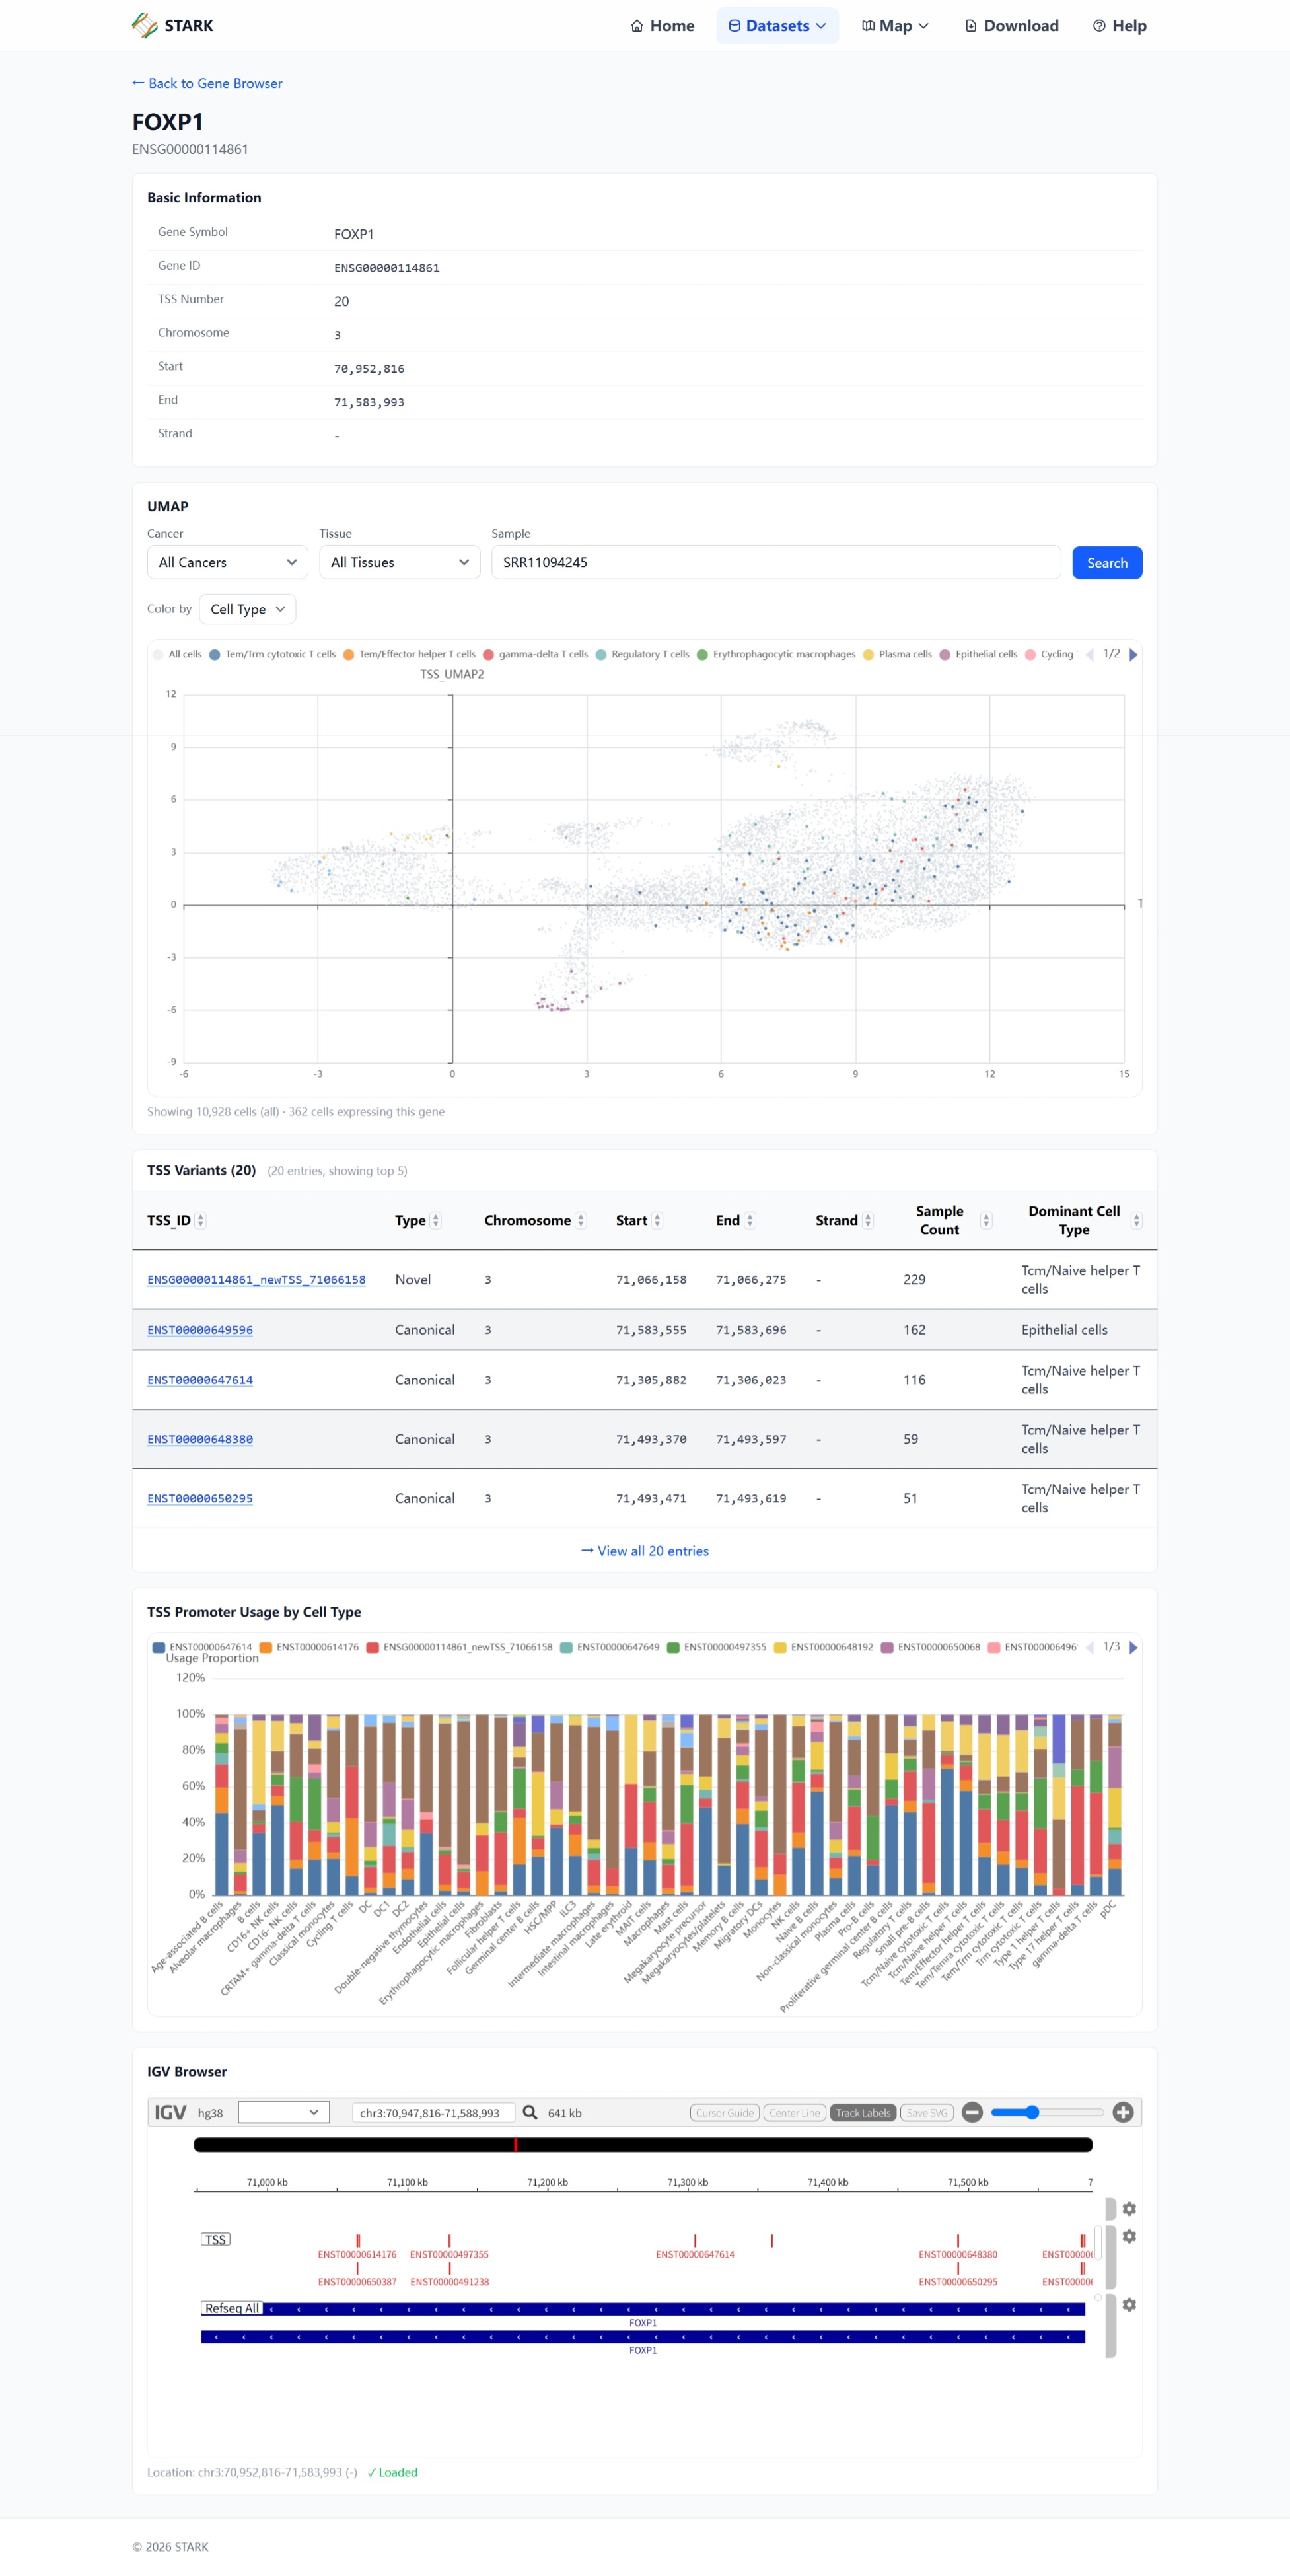
Gene Detail
The Gene Detail page (accessible from the Gene Browser) provides information about a gene and its associated TSS variants.
- Basic Information — gene symbol, ID, and genomic coordinates.
- TSS Variants — table of all TSS variants for this gene, linked to their TSS Detail pages.
- TSS Promoter Usage — stacked bar chart showing TSS usage proportions across cell types.